Chromatin accessibility data and tool release

Functional epigenomics uses high-throughput sequencing data to study how epigenetic modifications may affect gene expression and function across the entire genome. In this post we describe an assay that enables researchers to simultaneously interrogate endogenous DNA methylation state and chromatin accessibility in addition to the primary sequence variants normally available from whole genome Nanopore sequencing data.
Nanopore sequencing is capable of detecting chemical base modifications, as discussed in previous blog posts for DNA and RNA. Typically, these base modifications are endogenous to the sample and the result of a biological process. In this assay, however, we leverage the ability of Nanopore sequencing to detect exogenous base modifications, where these modifications would not occur naturally in the organism of interest. To recognize regions of accessible chromatin, we’ll introduce 6-methyladenine (6mA) residues via a methyltransferase enzyme (MTase). We do this by treating chromatinized DNA with a MTase that is not sequence specific, such as EcoGII, which will recognize any Adenine residue as a potential reaction site for deposition of a methyl group resulting in a 6mA base. Critically, Adenine bases that are occluded by a protein, such as a nucleosome, transcription factor, or other DNA-binding protein, will be blocked from reaction by the methyltransferase and remain unmodified. When we extract the DNA and sequence the resultant library, we can infer if a region was accessible to the MTase by enrichment of 6mA on the reads aligned to that region. Since no amplification or conversion is necessary, endogenous methylation such as CpG-context 5-methylcytosine (5mC) is retained on the DNA strands and can be detected as well. Finally, these libraries can be used for typical downstream analysis such as assembly, long and short variant calling, and differential methylation analysis, all with the added layer of chromatin accessibility information as well.
Data Access
Raw nanopore data in POD5 format as well as basecalled modBAMs with 5-hydroxymethylcytosine (5hmC), 5mC, and 6mA base modification calls are available for download from a public Amazon Web Services S3 bucket.
The data is located in the bucket at:
s3://ont-open-data/chrom_acc_2025.06
These datasets can be used as a reference to compare your experiments to as well as general exploration and testing.
See the tutorials page for information on downloading the dataset.
Sample preparation
We’ve developed a protocol that will be made available on the ONT community website that uses entirely commercially available reagents. Libraries were prepared using the Ligation Sequencing DNA V14 (SQK-LSK114) Kit and sequenced on a PromethION instrument to give the outputs below:
| Name | Flowcell | Condition | Throughput (Gb) | N50 (kbp) |
|---|---|---|---|---|
| Chromatin Accessibility Replicate 1 | PBA15156 | Chromatin accessibility | 105.72 | 19.4 |
| Chromatin Accessibility Replicate 2 | PAY22766 | Chromatin accessibility | 108.49 | 18.2 |
| Native Sample | PBA15131 | Native | 150.53 | 29.2 |
Basecalling and analysis
These reads were basecalled using the v5.2 high accuracy (HAC) model and associated modified base detection models. Specifically the software used was:
Basecalling these reads doesn’t require any special settings, simply using Dorado with the v5.2 models and 6mA models will suffice. Detecting 5hmC/5mC concurrently is optional, but recommended, below is an example command to detect 6mA at all sequence contexts and 5hmC/5mC at CpG dinucleotides.
# dorado version 1.0$ dorado basecaller hac,5mCG_5hmCG,6mA raw/pod5 --reference ${genome_fasta} > basecalls.bam
Predict accessible regions with Modkit
As of version 0.5.0, Modkit contains a command to predict regions of open chromatin and produce a BedGraph file that can be visualized on commonly used browsers.
For additional details see the online Modkit documentation.
We plan to continue to add functionality to the Modkit open-chromatin suite of tools.
# predict regions of open chromatin with Modkit$ modkit open-chromatin predict \basecalls/PAY82297/calls.sorted.bam \--region "chr19" \ # optional-o chr19_open_chromatin.bedgraph \--device 0 \--model dist_modkit_v0.5.0_5120ef7_tch/models/r1041_e82_400bps_hac_v5.2.0@v0.1.0
As you may notice by the --device 0 option, this is the first machine learning model in Modkit and it will take advantage of a GPU if you have one available.
The GPU resources required for this command are modest and the model can be run on a CPU as well (--device cpu).
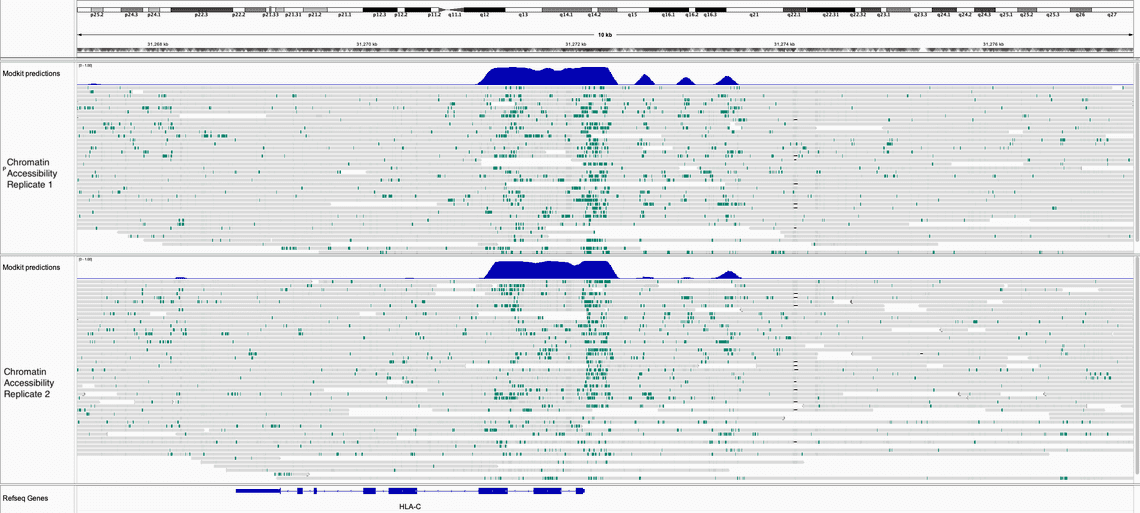
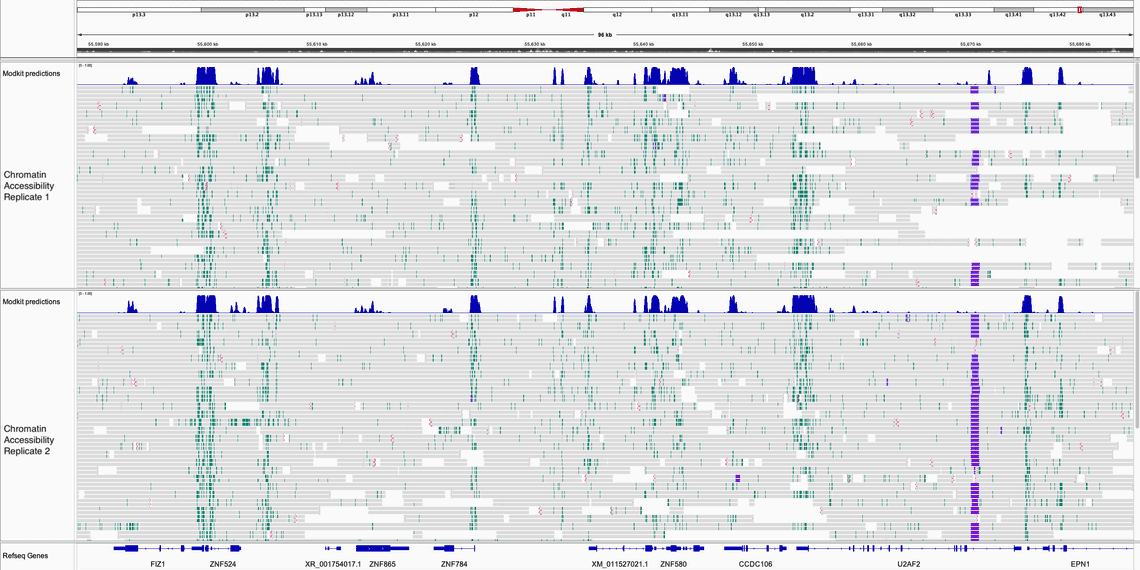
In the two IGV screen shots below, one of the HLA-C locus and one of the ZNF locus we can see the similarity of the the 6mA enrichment between the two runs.
In both images, the top track is the output of modkit open-chromatin predict which predicted probability of the chromatin being accessible.
Quantifying 6mA enrichment
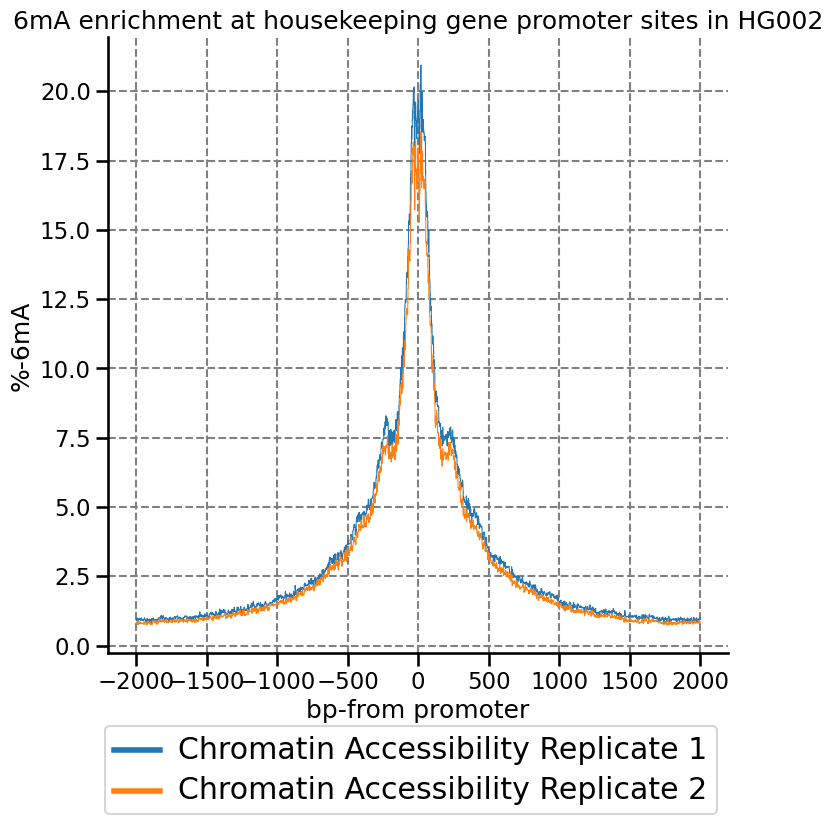
One of the project aims was to develop a protocol that achieves high “signal over background”, meaning 6mA is enriched in regions of open chromatin and regions of heterochromatin have low 6mA levels.
We can get an estimate of this measure by using modkit localize in regions where we expect chromatin to be accessible to the methyltransferase, such as house keeping gene promoters, shown below.
Relative 6mA enrichment levels are reproducible across preparations
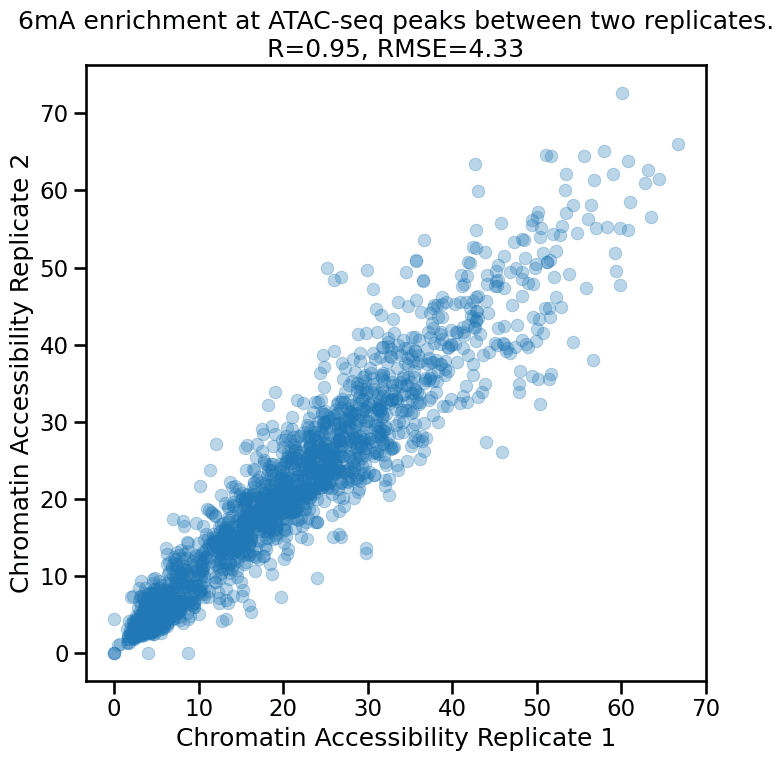
Methods that use enzymatic treatment will almost always come with some amount of variability due to changes in reagents, measurement error, etc. Above we see both runs have similar but not identical peak 6mA levels. At a finer resolution, below we show that there is a strong correspondence between the 6mA levels between samples at ATAC-seq peaks.
Accurate endogenous methylation calls maintained with chromatin accessibility protocol
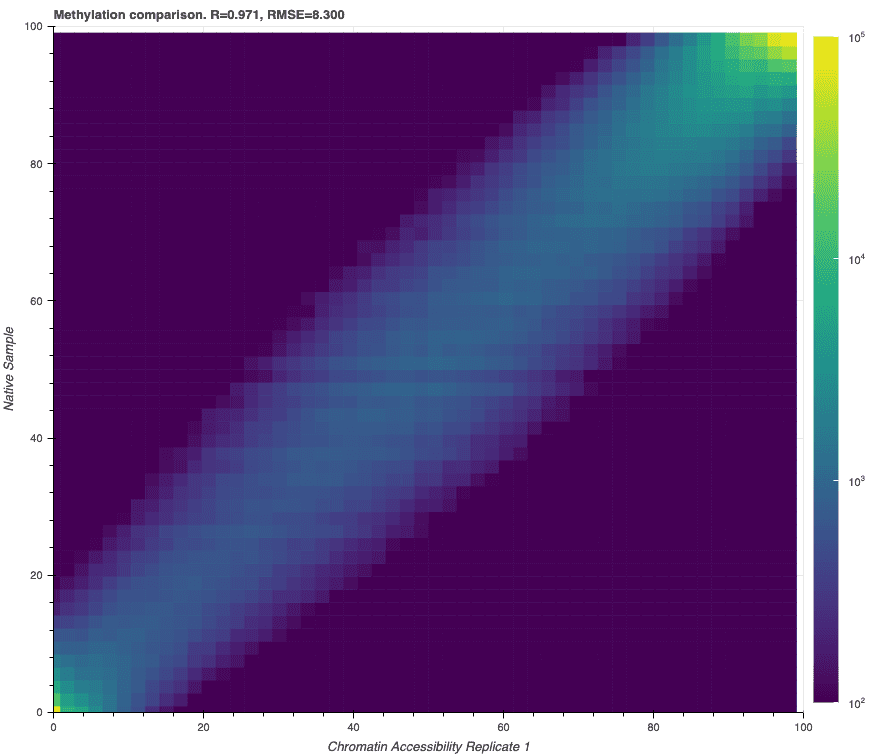
One important utility of this method is that endogenous 5mC/5hmC methylation detection performance is preserved, making it possible to observe concurrent changes in regulation due to DNA methylation as well as chromatin accessibility. Below we show the CpG methylation frequency for two matched samples, one with the chromatin accessibility methyltransferase treatment and one prepared using the typical human variation workflow.
Read-level accuracy is maintained through MTase treatment
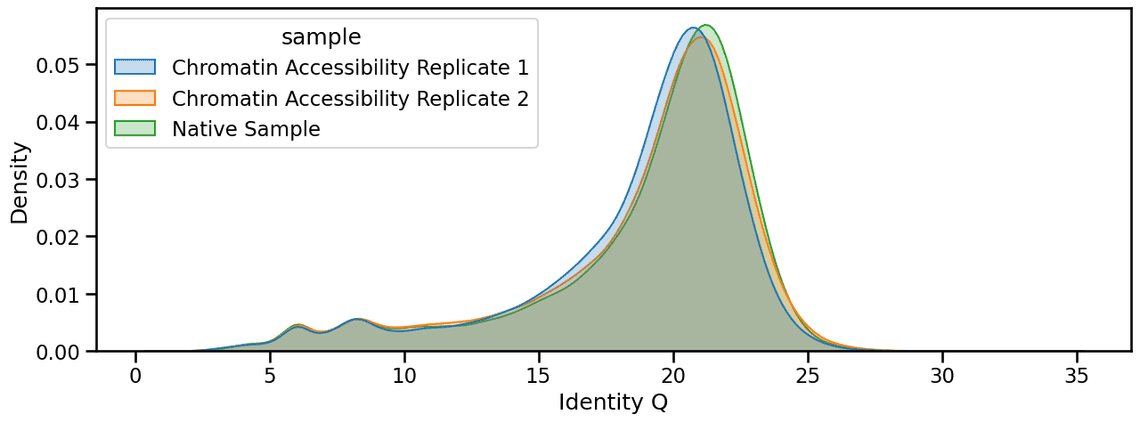
Finally, with the v5.2 High-Accuracy basecalling models, there is little to no difference in basecalling accuracy when a sample is subjected to the chromatin accessibility protocol.
Similarly we have not observed a change in variant calling performance with Clair3 on these samples, results summarized below:
| Name | Flowcell | Median Accuracy (Q) | Mean Accuracy (Q) | CA-treatment | Mean Coverage | SNP F1 Score, %, 30X | Indel F1 Score, no_HPs, %, 30X |
|---|---|---|---|---|---|---|---|
| Chromatin Accessibility Replicate 1 | PBA15156 | 19.99 | 19.82 | + | 34.11 | 99.14 | 97.69 |
| Chromatin Accessibility Replicate 2 | PAY22766 | 20.25 | 20.39 | + | 35.0 | 99.15 | 97.7 |
| Native Sample | PBA15131 | 20.40 | 19.83 | - | 48.56 | 99.15 | 97.82 |
Discussion
Here we’ve released to the community a reference dataset showing the capability of Nanopore sequencing to detect regions of accessible chromatin as well as native methylation and primary sequence variants. We hope that this release will inspire researchers to download and try the protocol and compare their results to the ones presented here.
Table Of Contents
Related Posts
Related Links
